


Investigation on the Physics behind the Tuning Slide of a Trumpet
How does changing the extension of the slide on a trumpet affect the frequency of the wave?

Background Theory:
There are two types of waves, longitudinal waves where particles move parallel to the direction of the energy and transverse waves where particles move perpendicular to the direction of the energy (Types of Waves). Both of these waves can create standing waves which is when two waves with the same amplitude and frequency move in opposite directions and are superimposed meaning their energy is either cancelled out or added together (Gregerson). Sound waves fall under the category of longitudinal waves meaning they push particles such as air molecules, towards and away from the direction of the energy (Types of Waves).
The point of a standing wave where there is no displacement is called a node and the point of the highest displacement is an antinode which is marked N and A on the diagram to the left (first three harmonic standing waves in a stretched string). Standing waves have natural frequencies known as harmonics and the simplest harmonic is the fundamental harmonic (Elert). The fundamental harmonic, second harmonic, and third harmonic are shown on the diagram below.

Trumpets are considered open-ended instruments since air is blown through the mouthpiece on one side and exits through the hole at the bell creating an antinode at either end(Clintberg). The effect on the standing wave can be seen on the graph to the right (Kuphaldt). The wavelength to tube length ratio will stay the same, but compared to the tube with 2 closed ends, where there was a node, there is now an antinode and where there was an antinode, there is a node. The wavelength of the fundamental harmonic stays 12 for both situations.

Predicted Outcome:
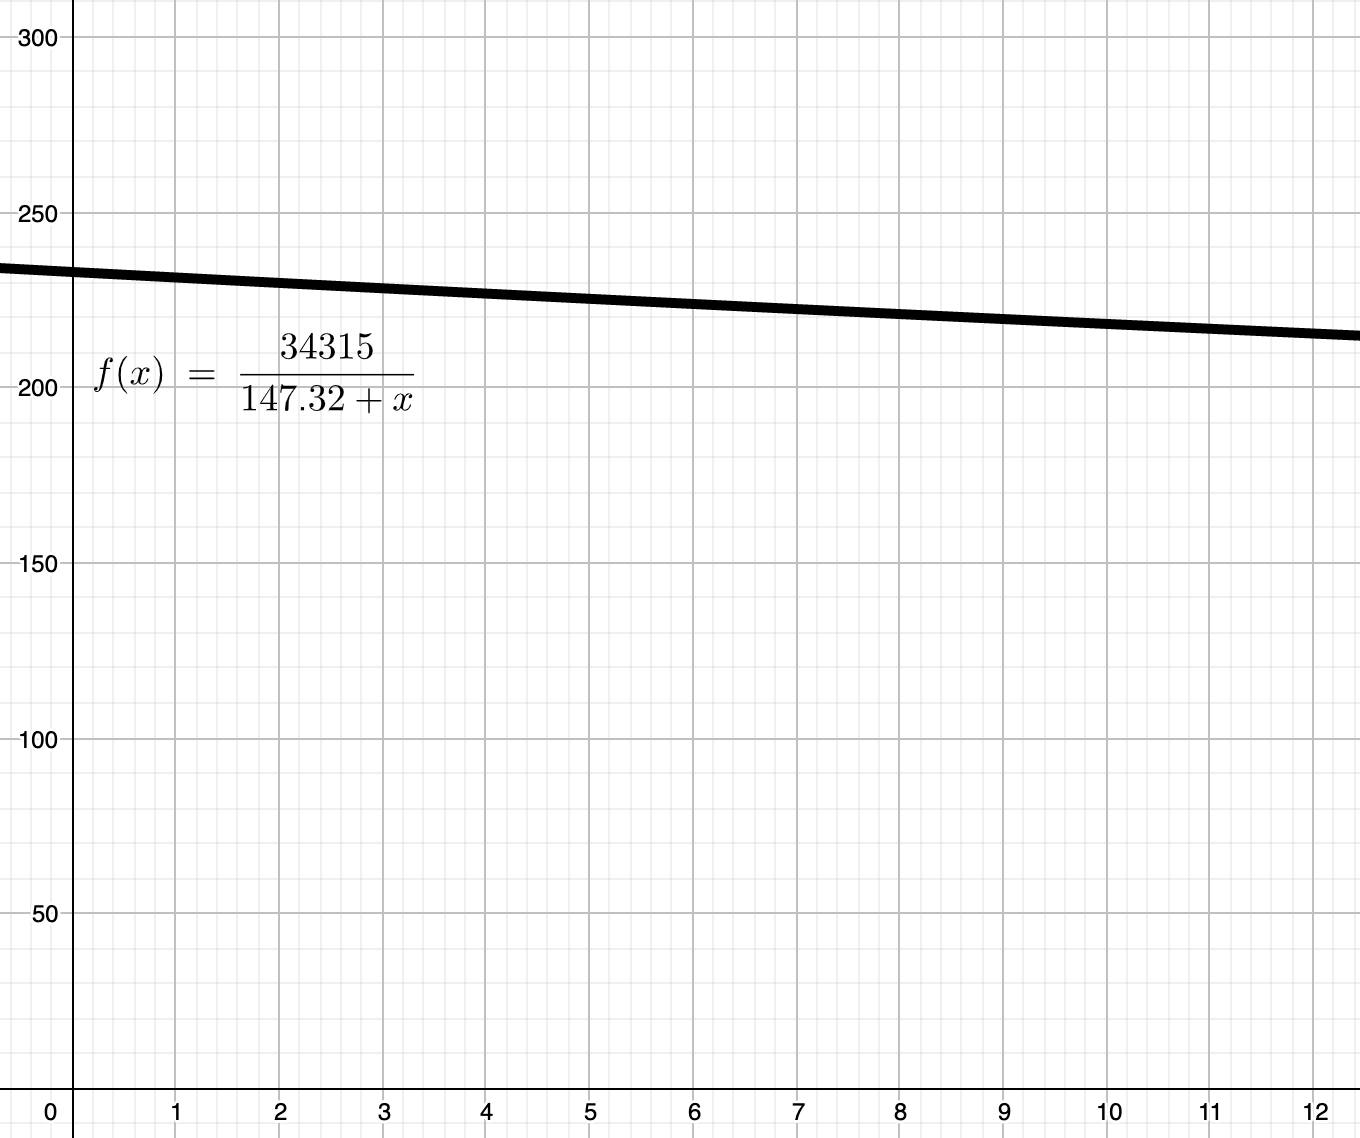
The formula connecting wavelength with frequency is f=v. The note I will be playing on my trumpet is middle C or concert b flat which is the lowest playable note without using any valves. This is done so that extra additions to the length of the tube are not necessary. The middle C is the second harmonic of the trumpet (Fundamental and harmonic frequencies). This means the wavelength is 1L which L is the length of the tube. The length of a trumpet tube is about 4’10” (Davis). This is 147.32 cm which is the value that will be used. The value for velocity is the speed of sound which is given by the equation vsound=643.855(T273.15)0.5 in knots (Brice). At room temperature, the speed of sound is calculated to be 343.15ms-1 or 34315cms-1. This means the value of the frequency in the experiment should match the equation f=34315147.32+d where d represents the IV. This equation is graphed on GeoGebra and shown below.
Variables:
Independent Variable:
The distance extended by the trumpet slide (d). Due to the slide extending to a maximum of 9cm, the distances used start from 0cm and increase by 1.5cm until the slide is extended to 7.5cm (0.0, 1.5, 3.0, 4.5, 6.0, 7.5)±0.1cm.
Dependent Variable:
The dependent variable will be the different frequencies measured from the trumpet using the Physphox application. The error will be determined by the variation of data. The frequency will be measured to one decimal place since any more would not have a significant enough affect on the data.
Control Variables:
Temperature
The speed of sound is affected by the temperature of the particles around it, since heat is kinetic energy so higher temperatures increase the speed of sound. The equation for the speed of sound affected by temperature is v=643.855(T273.15)^0.5 in knots (Brice). The experiment will be in a room temperature (20C) environment and using the equation for the speed of sound, the speed will be 343.15 meters per second (Brice).

Microphone
Microphones record sound waves and convert them into electrical energy, but depending on the microphone, there might be slight differences in the way they convert the sound waves (Arthur). Physphox uses the microphone in the phone and it will be used for all trials.
Trumpet
Due to use over time, Trumpets may have small dents or deformations which may cause slight inconsistencies in the tube. These inconsistencies vary depending on the trumpet and can affect its frequency.I will be using the same silver brass trumpet for all trials.
The note played
The way the trumpet plays multiple notes is by changing the length of the tube by pressing valves or by producing faster or slower vibrations into the mouthpiece to change harmonics which both influence the frequency. This means that the note played should be consistent to have meaningful value to the data. The note that will be used in all trials is the concert b flat or middle C which is the lowest playable note without using any valves and is also the second harmonic.
Trumpet Player
Different trumpet players will have their own techniques for buzzing and not everyone's embouchure is the same which will affect how tight their lips are and how fast the air they blow is which can have small effects on the frequency. I will be the trumpet player for all trials.
Equipment List:
The app Phyphox designed by RWTH Aachen University
Measures the frequency of sound (±0.01 Hz)
Computer with Logger Pro
Record and Graph data
Ruler-30 cm
Measure how much the trumpet slide has been extended (±0.1cm)
B♭ Trumpet with mouthpiece
Contains the IV
Experiment Setup:
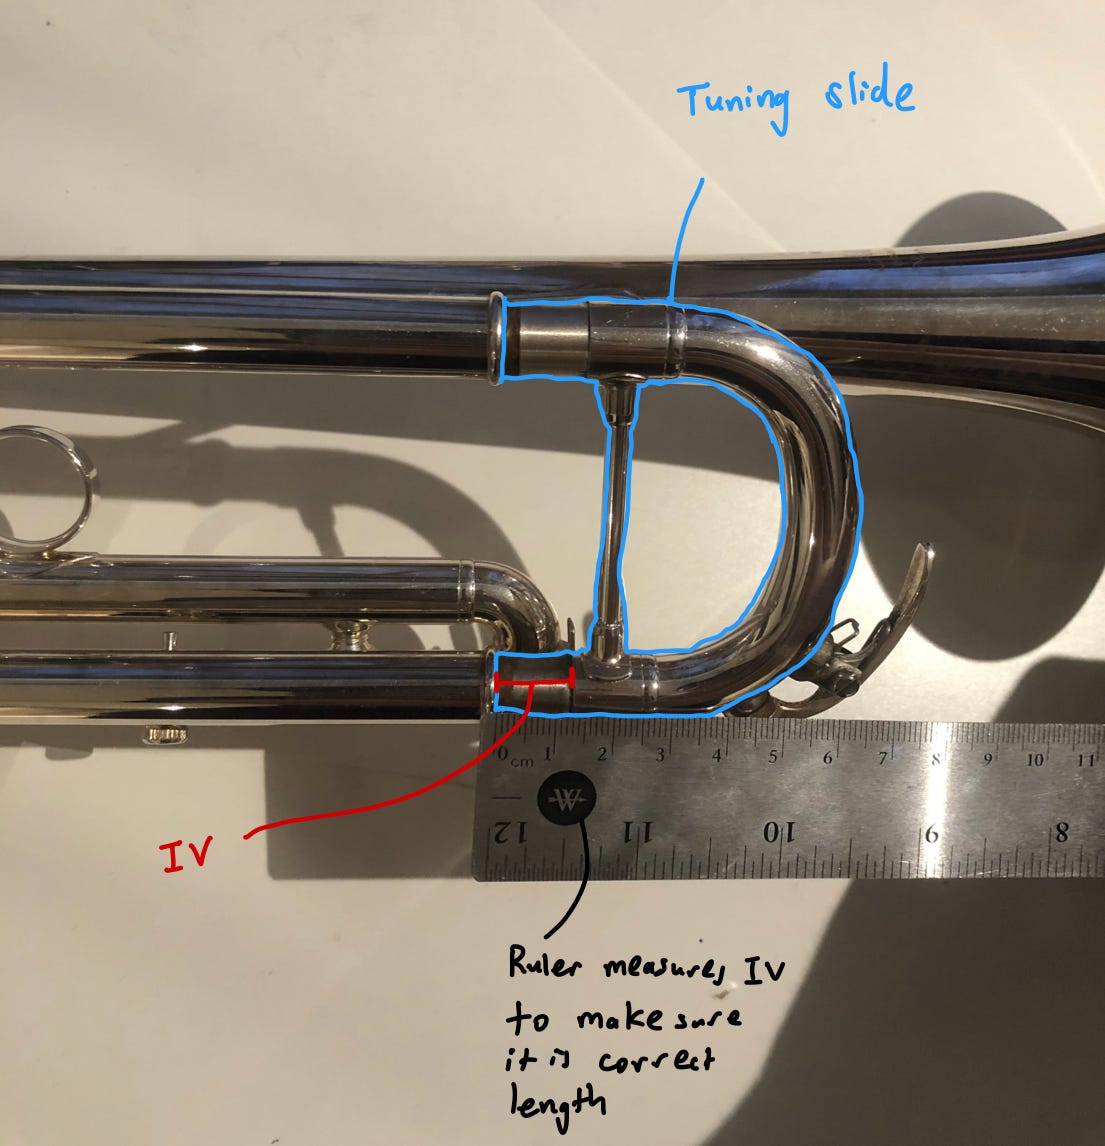
This photo of the trumpet shows how the IV(d in cm) will be measured. It also shows that the ruler's smallest measurement is 1mm so the error bars for d will be ±0.1cm. After the IV is set up for each set of trials, the phone would be placed on the table in front of the trumpet to record the data.
Safety Issues:
The only risk from this experiment is lightheadedness or passing out from playing the trumpet for a long period of time, exerting large amounts of pressure on the brain, and without taking a breath to receive more oxygen. This is very rare and can be completely prevented by limiting each trial to 10 seconds long through the countdown option in the app.
Procedure:
The experiment is set up, including assembling the trumpet and oiling slide so that the IV may be changed later
Using a ruler, make sure the slide is extended to the length of the IV tested (Not be necessary for the first IV since it is equal to 0)
A timed run for 10 seconds is set up in the audio correlation tool in Phyphox and the phone is placed on a close surface
Start the timed run on Phyphox and hold the trumpet 15cm away from the phone and play a low C(concert B flat) until the timed run is over which is at least 10 seconds
Record down the frequency recorded on Phyphox on Logger Pro
Repeat Steps 3 to 5 for 4 more trials
Adjust the IV to the next length
Repeat Steps 3 to 7 for 5 more IV (1.5, 3.0, 4.5, 6.0, 7.5)
Raw Data Collection:
The data below was collected via the procedure above.

Qualitative Observations:
As the length of the tube was extended past 3cm, it became more difficult to hold the note which lead to some trials needing to be repeated so that the frequency of the played note was recorded.
Frequency Uncertainty
The uncertainty was calculated by finding the range between the average and the data value that skewed the farthest from the average for the trial data of each IV.

Data Analysis:
Raw Data Graphed

The average frequency for each IV was graphed against the distance to create this graph. One initial observation is that the data does not correlate with a linear trendline and rather a trend line more similar to a parabola. It is also noted that the data value for IV=0.0cm actually had a lower frequency than IV=1.5cm. This contradicts the hypothesis made earlier that predicted the frequency would decrease as the distance was increased. The rest of the data fit the hypothesis so it is possible the first data value is an outlier.

After removing the first data point and using a linear trend line with the worst fit lines, the data still doesn’t correlate very strongly with the trend line. It can still be determined that the data has a negative correlation due to the trendline following the data having a negative slope.
Linearizing the data:

Linearizing the data would allow a linear trendline as well as worst fit lines to be added to the graph. To linearize the data, the distance is squared to see a better correlation and to identify further outliers. To find the uncertainty for d², the following equation is used:

By using this equation, the fractional uncertainty obtained is:
(0.1*Distance)*2
This equation is then used to find the error which is shown on the d² error column. It is also noted that the IV 0.0 was removed from the data set due to it being an outlier.
Linearized Data graphed

After graphing the data, it is clear that the data points have a clearer linear correlation and all of their error bars intersect the trend line at some point. The slope of the trendline is -0.34 indicating the data shows an inverse proportion between distance and frequency.
Based on the equation v=fv is constant (343.15 mps) which means when the IV(wavelength) is increased, the frequency would theoretically decrease with a negative correlation as stated in the hypothesis. The data analysis did reveal the trendline has a negative slope, so therefore the data does support the hypothesis as it reveals a negative correlation.

By graphing the theoretical data (red) calculated using the equation f=34315147.32+d which was calculated earlier with the raw data (blue), interestingly, the first data point which was initially labelled as an outlier is the closest to the predicted value with an almost 0.0% difference. Even the values with the largest difference which is IV=7.5cm has a 2% difference which reveals that the data is fairly accurate.

Conclusion:
Through the research question: “How does changing the extension of the slide on a trumpet affect the frequency of the wave?”, an experiment was created around the equation v=f to confirm that frequency and wavelength had a negative correlation. Based on the analysis, it can be reasonable to consider that the data supported this. The fact that the raw data also skewed from the predicted data and did not immediately follow a linear trend are notable and don’t follow the equation v=f since the equation indicated that these two variables graphed against each other should have followed a linear trend, but since the error bars still crossed the linear trendline, it is possible to conclude that these data values slightly differed due other variables.
Evaluation:
I believe that overall the experiment went well. Although the data did not perfectly match expectations, it was still able to be somewhat accurate with a maximum 2% difference which was measured from the data analysis and still had a negative correlation which supported the formula f=v which also helped answer the research question.
The largest issue with the data is the fact that it did not have a linear correlation, I tried my best to find an explanation for this phenomenon. One theory for these inconsistencies is a lack of consideration of the bell of the trumpet. I did not consider whether the bell of the trumpet would have an affect on the data despite the shape of the tube changing since amplitude doesn’t affect wavelength or frequency, but I used an external source for the length of a trumpet tube and it is uncertain whether that measurement included the bell of the trumpet. This is still unlikely since if this was true, the data would still be linear despite not lining up with the predicted data.
I believe it was more likely that the differences are due to human error. When measuring the frequency of the sound produced by the trumpet, I noticed that the frequency was not consistent because I wasn’t able to produce a perfectly consistent airflow which meant that the only way to find a more accurate value would be to find the average of many trials. I believe more trials would have further lessened the impact of the outliers and created a data set with a more linear correlation.
Since the application that I used measured the frequency for one point in time rather than an average frequency, I could have instead used a vernier microphone connected to Logger Pro so that I could manually look over the frequency waves and ignore outliers to produce more accurate data.
Arthur. “Complete Guide to Microphone Frequency Response (with Mic Examples).” My New Microphone, 4 Aug. 2019, https://mynewmicrophone.com/complete-guide-to-microphone-frequency-response-with-mic-examples/#:~:text=Microphones%20respond%20to%20sound%20waves,with%20a%20range%20of%20amplitudes.
Brice, Tim, and Todd Hall. “Speed of Sound Calculator.” Speed of Sound Calculator, NOAA's National Weather Service, 17 Apr. 2020, https://www.weather.gov/epz/wxcalc_speedofsound.
Clintberg, Bryan. Lesson 51: Closed & Open Ended Pipes, http://www.studyphysics.ca/newnotes/20/unit03_mechanicalwaves/chp141516_waves/lesson51.htm.
Davis, Robert. “How Long Are Trumpets? 6 Examples (Coiled & Uncoiled).” Brasshero.com, https://brasshero.com/how-long-trumpets-coiled-uncoiled/.
Elert, Glenn. “Standing Waves.” The Physics Hypertextbook, Hypertextbook, https://physics.info/waves-standing/#:~:text=Any%20system%20in%20which%20standing,harmonic%2C%20third%20harmonic%2C%20etc.
“First Three Harmonic Standing Waves in a Stretched String.” Encyclopædia Britannica, Encyclopædia Britannica, https://www.britannica.com/science/standing-wave-physics#/media/1/563065/3539.
Fundamental and Harmonic Frequencies, Elvers, https://elvers.us/perception/funHarm/.
Kuphaldt, Tony R. “Standing Waves and Resonance: Transmission Lines: Electronics Textbook.” All About Circuits, https://www.allaboutcircuits.com/textbook/alternating-current/chpt-14/standing-waves-and-resonance/.
“Standing Wave.” Edited by Erik Gregerson, Encyclopædia Britannica, Encyclopædia Britannica, Inc., https://www.britannica.com/science/standing-wave-physics.
“Types of Waves - Mechanical, Electromagnetic, Matter Waves & Their Types.” BYJUS, BYJU'S, 17 May 2022, https://byjus.com/physics/types-of-waves/#types-of-waves-in-physics.